Plots and interactive views
Plotting, video, and most other scientific graphics in ACQ4 are dispalyed in graphics views provided by PyQtGraph.
Mouse interaction
All graphics views in ACQ4 may be scaled and panned to interactively explore the displayed data. For this purpose it is recommended to use a standard 3-button (with wheel) mouse; however, a simplified interaction mode may be used for one-button mice (see mouse mode below). By default, graphics views have the following mouse interaction:
- Right-drag causes the view to zoom. In most cases, dragging the mouse to the right will cause the data to stretch horizontally, whereas dragging the mouse upward will cause the data to stretch vertically. However, some views have a fixed aspect ratio (such as when viewing most images); in this case dragging will always cause both axes to scale proportionally.
- Middle-drag causes the view to pan, allowing different parts of the data to be viewed.
- Left-drag is used to interact with any movable objects such as selection areas and ROIs. In the absence of such an object, left-dragging the mouse will instead pan the view exactly as middle-dragging does.
- Wheel is used to zoom the view proportionally.
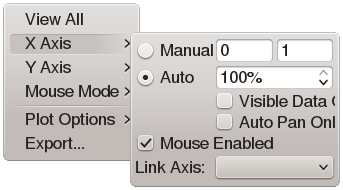
In many instances, the graphics view includes x- and y-axes displayed at the edges of the view. In this case, the mouse interactions described above may be performed over either axis to limit changes to that axis. For example, rolling the mouse wheel over the y-axis causes the view to scale vertically.


